030 - Plastic hinging
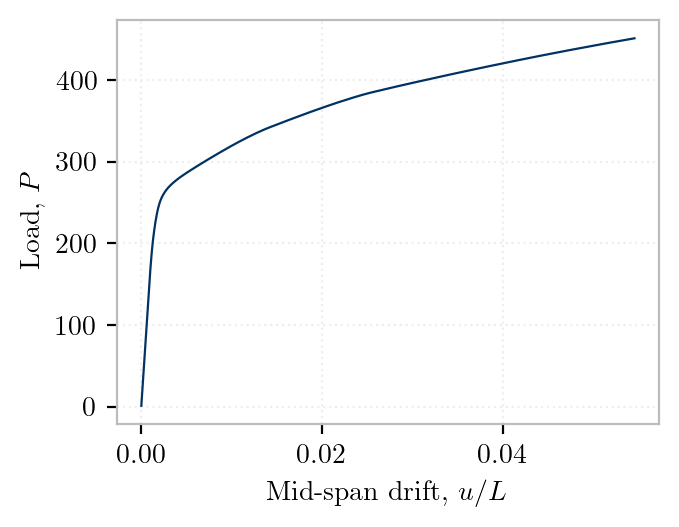
2 min read • 317 wordsPlastic hinging in a fix-fix girder under a point load is simulated using J2 plasticity.
from math import sqrt
import veux
from shps.shapes import WideFlange, Rectangle
import opensees.openseespy as ops
import matplotlib.pyplot as plt
try:
    plt.style.use("veux-web")
except:
    pass

def create_girder(element, shape, fy):
    model = ops.Model(ndm=3, ndf=6)

    a = 10
    L = 30

    model.node(10, (0, 0, 0))
    model.node(20, (a, 0, 0))
    model.node(30, (L, 0, 0))
    model.fix(10, (1,1,1,  1,1,1))
    model.fix(30, (1,1,1,  1,1,1))

    mat = 1
    E = 29e3
    nu = 0.3
    K = E/(3*(1-2*nu))
    G = 0.5*E/(1+nu)
    model.nDMaterial("J2Plasticity", mat, K, G, fy, fy, 0, 0.01*E)
#   model.nDMaterial('J2BeamFiber', mat, E, nu, fy, 0.1*E, 0.0)

    model.section("ShearFiber", 1, GJ=0)
    for fiber in shape.fibers():
        y, z = fiber.location
        # TODO: Remove warping for simplicity
        model.fiber(y, z, fiber.area, material=mat, warp=[fiber.warp[0], [0,0,0], [0,0,0]],  section=1)

    model.geomTransf("Linear", 1, (0,0,1))
    model.element(element, 1, (10,20), section=1, transform=1)
    model.element(element, 2, (20,30), section=1, transform=1)

    return model

if __name__ == "__main__":
    fy   = 50
    if False:
        J    = 5.26
        Cw   = 15000
        Ix   = 2700
        Zx   = 254
        Sx   = 222
        Iy   = 109
        Zy   = 37.5
        Sy   = 24.0
        shape = WideFlange(
                    tf = 0.875,
                    tw = 0.515,
                    d  = 24.3,
                    b  =  9.07,
                ).create_shape()
    else:
        d = 10/sqrt(5)
        b = 4
        shape = Rectangle(d  = d, b  = b).create_shape()
        Zx = b*d**2/4

    L = 30
    a = 10
    Pmax = 1.5*(2*Zx*fy/(a*(L-a)))*L

    model = create_girder("ForceFrame", shape, fy)
    print(f"Mp = {Zx*fy}")
    print("Element: ForceFrame")
    input()

    artist = veux.create_artist(model)
#   artist.draw_sections()
    artist.draw_outlines()

    #
    # Loading
    #
    model.pattern("Plain", 1, "Linear", loads={20: (0,-1,0,  0,0,0)})
    model.integrator("LoadControl", Pmax/500)
#   model.test("NormDispIncr", 1e-10, 20, 1) ; # OK with J2BeamFiber, bad for J2
    model.test("NormDispIncr", 1e-8, 30, 1)
    model.analysis("Static")

    P = []
    u = []
    while model.getTime() < Pmax:
        print(model.getTime())
        if model.analyze(1) != 0:
#           raise ValueError(f"Analysis failed at time = {model.getTime()}")
            print(f"Analysis failed at time = {model.getTime()}")
            break
        P.append( model.getTime())
        u.append(-model.nodeDisp(20,2)/L)

    artist.draw_outlines(state=model.nodeDisp)

    fig, ax = plt.subplots()

    ax.plot(u, P)
    ax.set_xlabel(r"Mid-span drift, $u/L$")
    ax.set_ylabel(r"Load, $P$")
    fig.savefig("img/e0030.png")
    plt.show()

    veux.serve(artist)